we create value for our clients
who are Prindex_
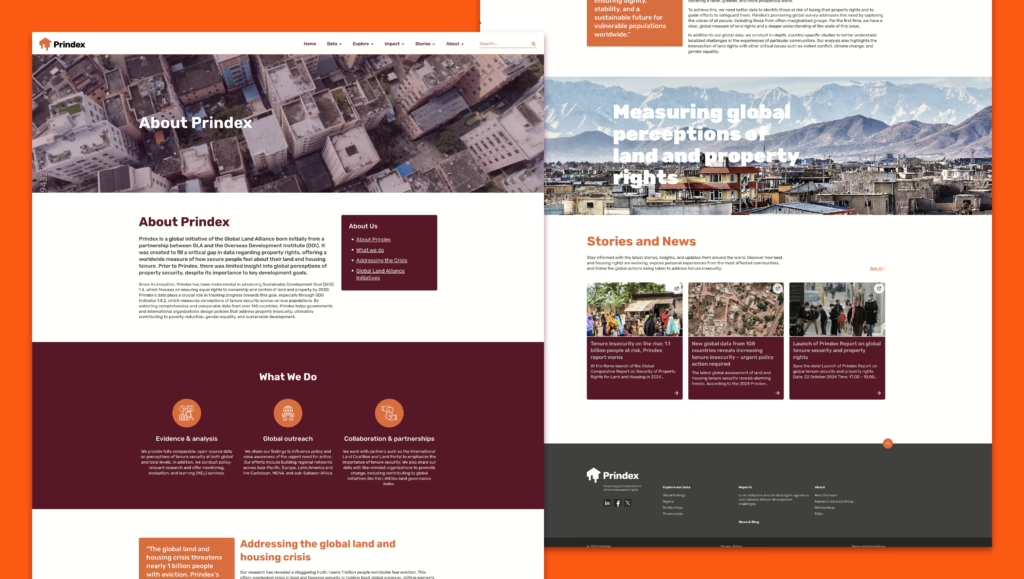
Prindex is a global initiative of the Global Land Alliance born initially from a partnership between GLA and the Overseas Development Institute (ODI).
Since its inception, Prindex has been instrumental in advancing Sustainable Development Goal (SDG) 1.4, which focuses on ensuring equal rights to ownership and control of land and property by 2030. Prindex’s data plays a crucial role in tracking progress towards this goal, especially through SDG Indicator 1.4.2, which measures perceptions of tenure security across various populations by collecting comprehensive and comparable data from over 140 countries.
why wirebox_
We’ve been developing websites and applications for over 15 years. Our experience helps advise clients how best to use the latest technologies to build from the ground up or improve existing systems.
Our Prindex Wagtail development project needed to apply changes for the new 2025 year on their existing Wagtail site – which required extensive updates to showcase data obtained in recent years.
The data structure had changed for over 140 countries! Additionally, feedback from the last website needed to be incorporated into the new build.
0ur approach_
When we start any project, we follow our process
- Step 1 – Discovery
We held an initial workshop remotely due to most of the Prindex team being in different countries and time zones. The purpose of the workshop was to gather all the information we needed to start the project. Prindex had an existing site and the Prindex team outlined the parts they wanted to improve and change from previous years. The dataset was changing as well, which meant data could be displayed in a different way. Lastly, we discussed feedback from users to to see how we could improve on the new version. - Step 2 – Analyse
With all the information at hand, it is important to review and analyse the approach needed to make the project a success. With the dataset being so large, the team had to explore how we could use it to display data in the most optimal way; while not affecting the experience of the site usage in terms of speed. - Step 3 – Define
Working through prototyping, we set out to design and build an optimal UX for Prindex. The site required a lot of data and displaying this would require detailed prototyping. We checked our ideas with the Prindex team to ensure we met their needs. - Step 4 – Development
Using the latest web technology that’s available is very important to us. This Prindex Wagtail development project naturally kept the site on Wagtail, where the last site was built, but we used Python as well. It’s a great coding language when you need to work through vast amounts of data. - Step 5 – Testing
One of the most important steps is testing. We thoroughly checked the site from browser to back-end testing, ensuring that everything worked and all the users were happy with the way the UX performed. - Step 6 – Delivery
Finally, we pushed the site live; managing transition from the old to the new site for a seamless handover. We monitored to see how the our new Prindex Wagtail development project was performing in situ and made any required changes in near real-time.
Outcome_
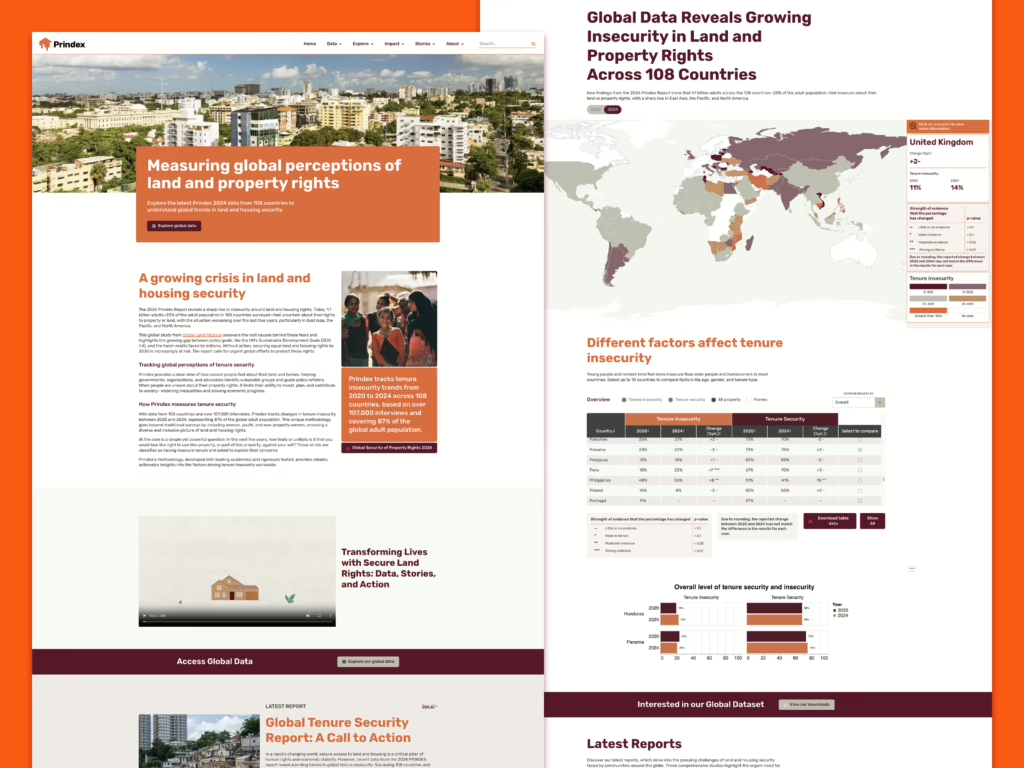
The Prindex website was updated to their new branding for 2025. This Prindex Wagtail development benefited from a smooth data architecture with several main updates on their Global Data Page. Users were pleased with the UX and the site ran swiftly, even with vast amounts of data.
The new global page followed on from the original page with a map of the world. But it has updated features which work better on mobile devices.
 | Popups for each country for overall info, instead of a hover. |
 | An easy display of the percentage difference, year over year. |
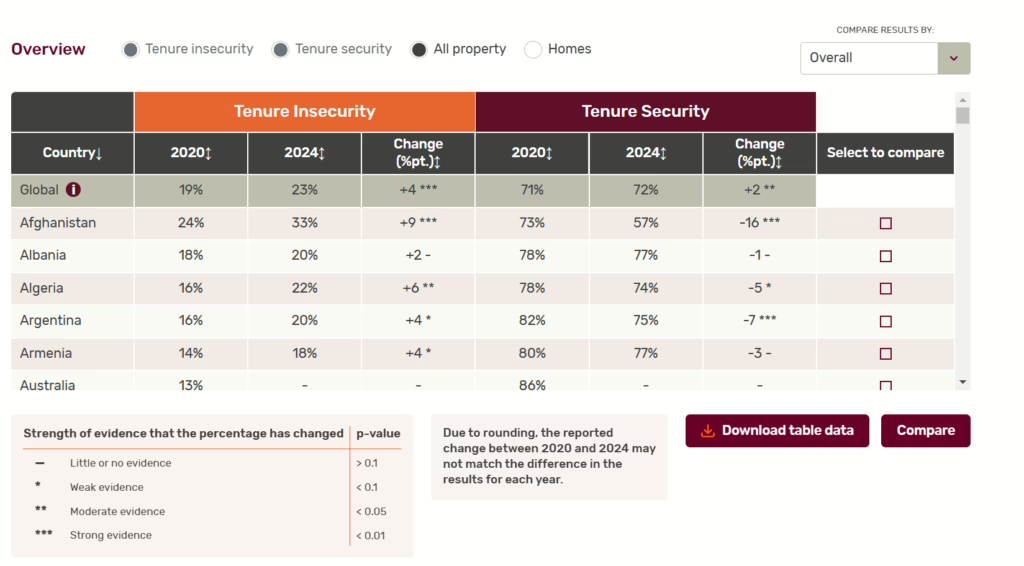
Insecurity Table
Displaying a large dataset for users to be able to view and digest is already difficult.
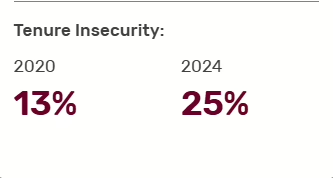
We also had to display different years to show the changes between Tenure Insecurity and Security.
We managed to achieve this with a table showing each county that you can select from to compare dynamically.
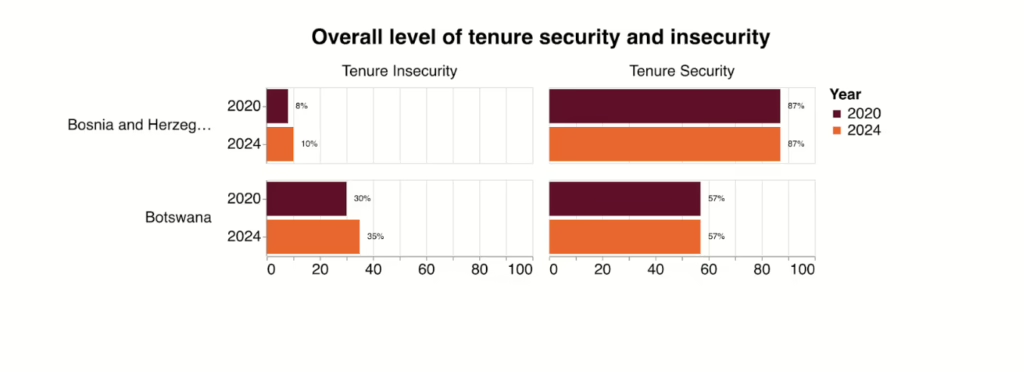
Comparing counties in graph format also helps visual audiences.
How was the work achieved
The site uses Wagtail CMS to generate the pages and make them editable.
An API was developed against the CSV database to make the data available to the table and graphing engines.
The data was large and indexing was required to make the data lookup faster.
Next Steps
Our next steps in this Prindex Wagtail development will be to develop more in-depth data per country in Q2 of 2025.
